Published on 25 Apr 2021 in
Data Science
How to transfer a Neo4j graph to a Python graph
Neo4j contains libraries such as GDS and APOC which allow the use of already existing advanced methods and algorithms. But if that’s not enough, in this jupyter notebook, I want to show that we can get the results of Cypher queries on a Python environment and using specialized graph libraries such as networkx we can use advanced algorithms, make measurements and machine learning over graphs.
! pip install neo4j
! pip install py2neo
from neo4j import GraphDatabase
uri = "neo4j://localhost:7687"
connect = GraphDatabase.driver(uri, auth=("neo4j", "************"))
session = connect.session()
query = "match (n)-[p]->(m), (m)-[r]->(j) return *"
results = session.run(query)
import networkx as nx
G = nx.Graph()

nodes = list(results.graph()._nodes.values())
for node in nodes:
    G.add_node(node.id, labels=node._labels, properties=node._properties)

rels = list(results.graph()._relationships.values())
for rel in rels:
    G.add_edge(rel.start_node.id, rel.end_node.id, key=rel.id, type=rel.type, properties=rel._properties)
import matplotlib.pyplot as plt
%matplotlib inline
plt.style.use('ggplot')
options = {
    'node_color': 'blue',
    'node_size': 800,
    'width': 5,

}
plt.figure(figsize = (100,100))
nx.draw(G, with_labels = False, **options)
plt.show()
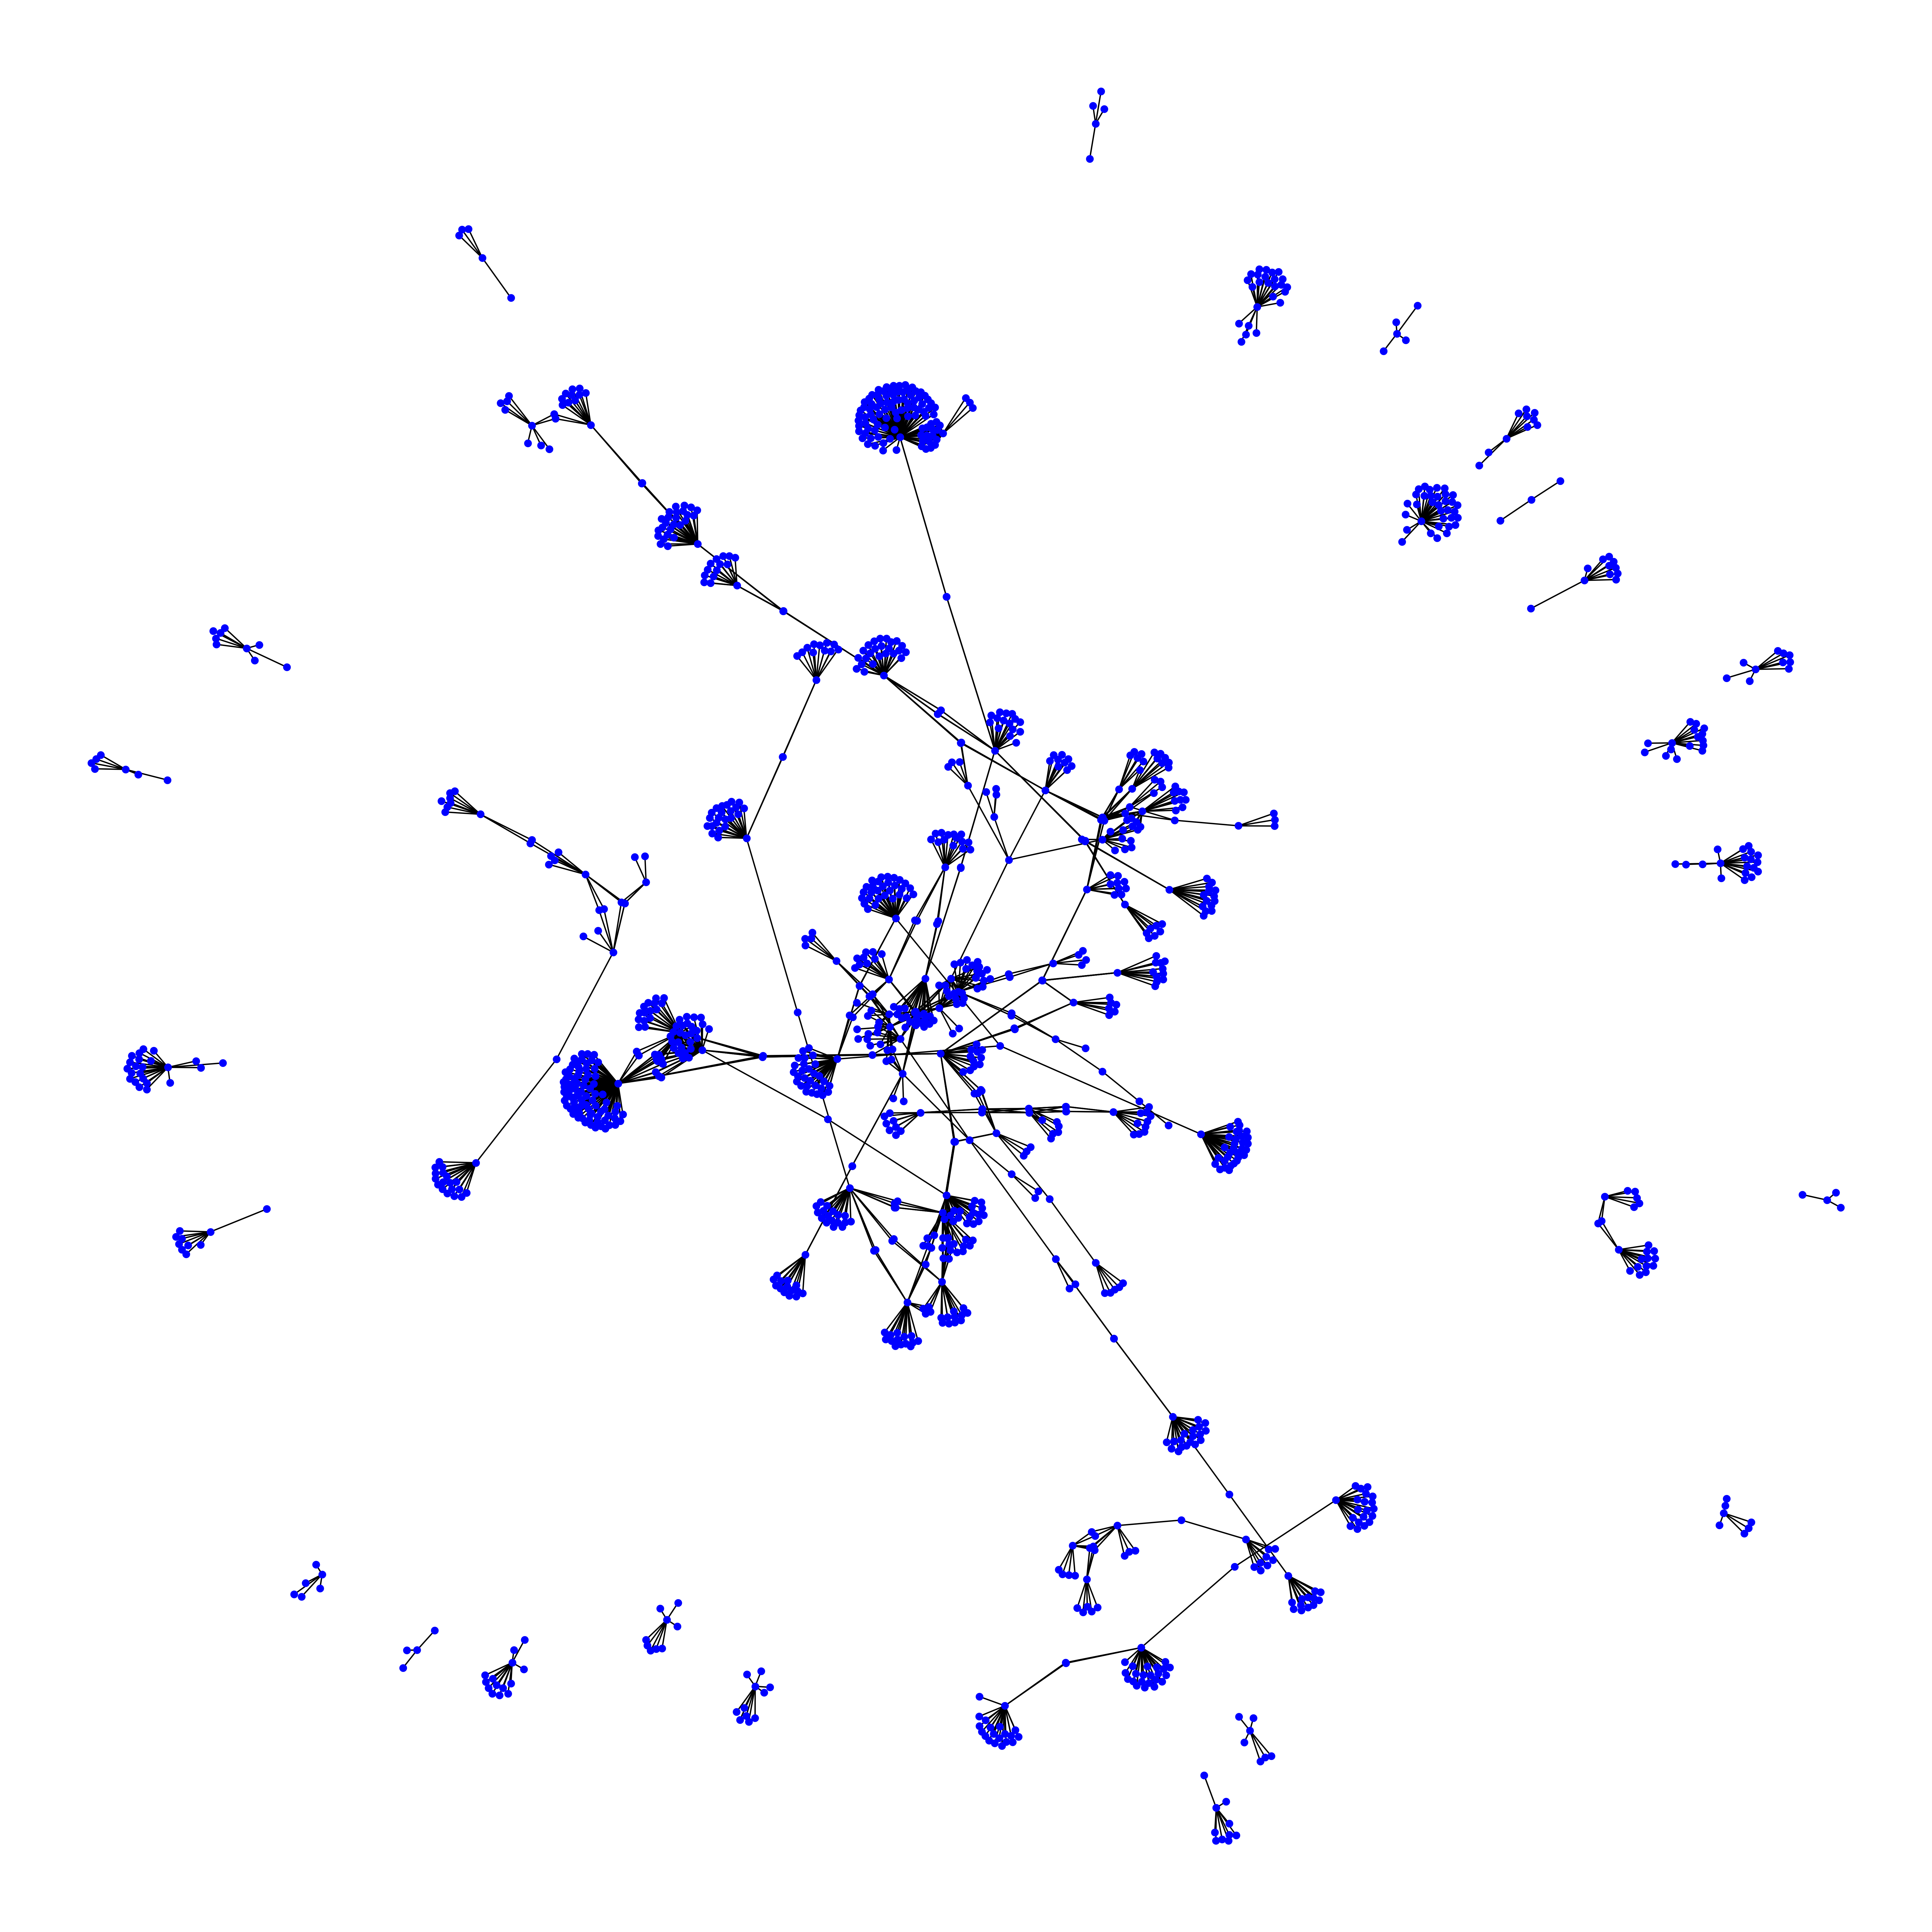
print(nx.info(G))
Name:
Type: Graph
Number of nodes: 1411
Number of edges: 1679
Average degree:   2.3799
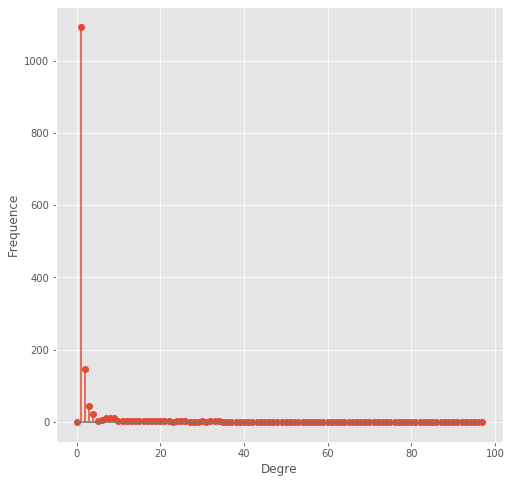
degree_freq = nx.degree_histogram(G)
y = degree_freq
plt.figure(figsize=(8, 8))
plt.stem(y)
plt.ylabel("Frequence")
plt.xlabel("Degre")
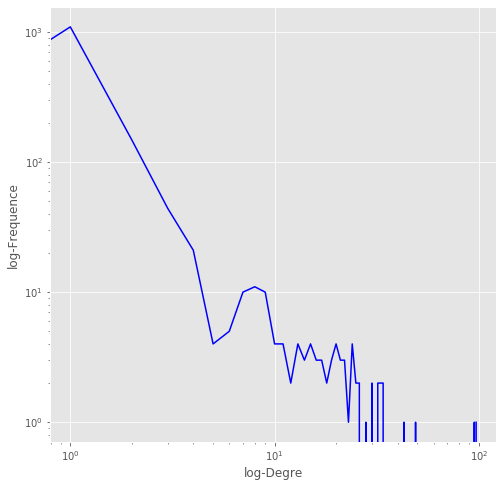
plt.figure(figsize=(8, 8))
plt.loglog(y, 'b-')
plt.ylabel("log-Frequence")
plt.xlabel("log-Degre")
degrees = sorted(G.degree, key=lambda x: x[1], reverse=True)
print(f'Maximum degree: {degrees[0][1]}')
print(f'Minimum degree: {degrees[-1][1]}')
Maximum degree: 97
Minimum degree: 1
def get_second_elem(iterable):
    return iterable[1]
all_deg = sorted(nx.degree_centrality(G).items(),key=get_second_elem, reverse=True)
print("The 10 nodes with the greatest degree_centrality:")
for node in all_deg[0:10]:
    print(node)
The 10 nodes with the greatest degree_centrality:
(4180, 0.06879432624113475)
(4197, 0.0673758865248227)
(4206, 0.03475177304964539)
(4190, 0.030496453900709222)
(4145, 0.024113475177304965)
(4175, 0.024113475177304965)
(4152, 0.02340425531914894)
(4198, 0.02340425531914894)
(4140, 0.02269503546099291)
(4199, 0.02269503546099291)
for d in all_deg:
    found_first_author_max_degree = False
    for node in nodes:
        if (node._labels == {'author'}) and (node._id == d[0]):
            print(f"The author {node._id} has the max degree centrality {d[1]}")
            print("His name: ",node._properties['name'])
            print("His topic: ",node._properties['topic'])
            found_first_author_max_degree = True
            break
    if found_first_author_max_degree:
        break
The author 4001 has the max degree centrality 0.005673758865248227
His name:   Attwood, Kristopher M
His topic:  sarcopenia